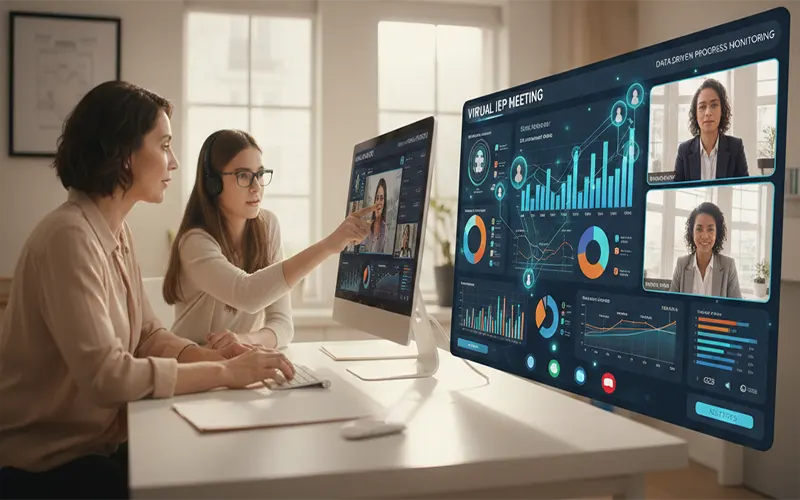
In 2026, the Individualized Education Program (IEP) has evolved from a static, bureaucratic document into a dynamic “living roadmap.” The shift toward virtual meetings—once a necessity—has become a preferred standard for many families and districts, offering greater flexibility and attendance. However, the move to digital platforms has highlighted a critical flaw in traditional reporting: static PDF progress reports and verbal anecdotes are no longer sufficient to justify high-stakes educational decisions.
Modern special education requires Visual Data Storytelling. By leveraging real-time progress monitoring tools, IEP teams can move away from “narrative descriptions” and toward objective, data-driven insights that foster collaboration, reduce conflict, and improve student outcomes.
1. The Shift to Visual Data Storytelling
The most significant advancement in 2026 IEP meetings is the transition from raw numbers to visual narratives. In a virtual environment, a spreadsheet is difficult to digest via screen share and often leads to “Zoom fatigue.”
- Trend Lines vs. Target Lines: Instead of stating a student is “making progress,” teachers now share screens to show an automated trend line. If the student’s actual performance (the trend) is consistently below the aim line (the goal), the team has an objective, non-confrontational reason to discuss a change in intervention.
- Heat Maps: For behavioral goals, heat maps allow parents and providers to see exactly when and where challenges occur. Seeing a “red zone” every Tuesday at 10:00 AM (during a specific transition) shifts the conversation from “the student is struggling” to “the environment at 10:00 AM needs modification.”
2. The 2026 Tool Stack for Virtual IEPs
To facilitate these data-driven conversations, school districts are increasingly adopting interoperable platforms that act as a “single source of truth.”
Real-Time Dashboards (Goalbook & SpedTrack)
Platforms like Goalbook allow teachers to map daily classroom assessments directly to IEP goals. During a virtual meeting, the facilitator can toggle between different goals, showing “snapshot” views of progress. This interoperability ensures that data collected in a math app like Khan Academy flows directly into the progress report without manual entry errors.
AI-Assisted Summarization
One of the most powerful tools in the 2026 kit is AI-driven data analysis. These tools scan months of behavioral logs and academic scores to identify “Inflection Points.” For example, an AI might flag that a student’s reading fluency spiked exactly after a new speech-to-text accommodation was introduced. This allows the IEP team to spend less time calculating averages and more time discussing what works.
Collaborative Parent Portals
Transparency is the antidote to friction. Modern tools now feature secure portals where parents can view progress visualizations before the virtual meeting begins. When parents arrive at the meeting already informed by the data, the virtual session can focus on strategy rather than disclosure.
3. Connecting Data to Decisions
The primary purpose of progress monitoring is to drive the Least Restrictive Environment (LRE) conversation. Data-driven tools provide the “why” behind every service change.
- Justifying Service Hours: If the data shows a student has mastered a social-emotional goal in a small-group setting, the visual evidence can support a move toward a general education setting with fewer support hours.
- Predictive Analytics: 2026 platforms often include “Early Warning” features. If a student’s trajectory suggests they will miss a goal by the end of the year, the tool flags this for the teacher three months in advance, allowing for a “Mid-Year Amendment” meeting to pivot the strategy before the student falls too far behind.
Data Type vs. Monitoring Tool Comparison
| Monitoring Type | 2026 Tool Example | Key Virtual Feature |
| Behavioral Data | BehaviorFlip / SWIS | Live “Heat Maps” for identifying environmental triggers. |
| Academic Skills | AIMSweb Plus / Goalbook | Automated “Trend Line” vs. “Target Line” overlays. |
| Social-Emotional | Everyday Speech | Video-based progress snapshots for social skill acquisition. |
| Compliance & Org | SpedTrack / Frontline | Collaborative “Parent Portal” for pre-meeting data review. |
4. Best Practices for Screen Sharing Data
Presenting data virtually requires a specific set of skills to ensure clarity and maintain student privacy:
- Clean Your Screen: Ensure no other student names or sensitive tabs are visible. Use a “Focus Mode” or a dedicated window for sharing data.
- Simplify the View: Don’t share a 50-row spreadsheet. Use the tool’s “Dashboard View” to show a high-level graph, then zoom in on specific data points only if requested.
- Narrate the Data: Don’t just show a graph; explain it. Use phrases like, “As you can see by this upward trend line, the introduction of visual timers in week 4 coincided with a 20% increase in task completion.”
5. Parental Engagement & Equity
Data-driven tools serve as an equalizer in the IEP process. For many parents, the jargon of special education can be alienating. However, a clear visual graph is a universal language.
- Empowering Co-Investigators: When a parent sees a “flat” line on a graph, they are empowered to ask, “What are we going to change to get this line moving up?”
- Language Accessibility: Many 2026 platforms offer “One-Click Translation” for data visualizations, ensuring that non-native English-speaking parents can engage with the data with the same level of depth as any other team member.
Virtual IEP Meeting Prep Checklist
- [ ] The Data Sync: Confirmed all teachers/providers have uploaded current data to the dashboard.
- [ ] The Portal Push: Sent the visual progress summary to parents 48 hours in advance.
- [ ] The Privacy Check: Prepared a “Clean Window” for screen sharing to protect FERPA data.
- [ ] The “What’s Next” Slide: Created a visual summary of proposed goal changes based on the data trends.
From Paper to Presence In 2026, the virtual IEP meeting is no longer a “paperwork event.” It is a data-driven strategy session. By utilizing modern progress monitoring tools, IEP teams can transform raw numbers into meaningful stories of student growth. These tools provide the objective clarity needed to build trust between schools and families, ensuring that the student’s needs—not the bureaucracy—remain at the center of the conversation.